Hey there, if you’re reading this, chances are you work with industrial reactors—either you run them, maintain ’em, or help pick the right gear for a plant. Full transparency, I’m part of a team that supplies industrial reactors (been at this for 12 years, seen my share of operations that either run like a dream or cost way too much in downtime), and one of the biggest headaches clients hit is figuring out how to actually analyze their reactor data to make those runs better. A lot of folks we talk to just grab their SCADA numbers and stare at ’em, not knowing where to start. So today, let’s break down the practical, data analysis methods we actually recommend for reactor ops—no stuffy PhD jargon that’ll make you zone out. Industrial Reactor
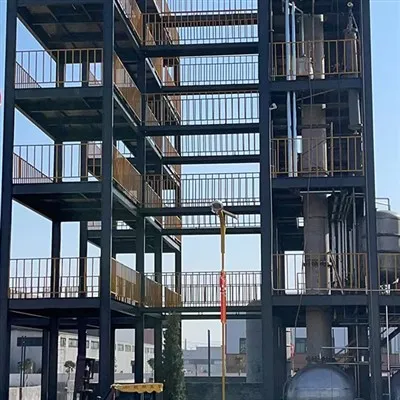
First, let’s set the scene: industrial reactors are those big, pressure-rated vessels where chemical reactions happen—think polymers, pharmaceuticals, fertilizers, whatever. The goal here isn’t just “collect data”—it’s turn that data into less waste, fewer unplanned shutdowns, and longer run times between maintenance. We’ve had clients come to us after a year of 70% uptime, leave using our reactors and the analysis methods we’ll chat about, and hit 92% uptime within six months. That’s not magic; that’s picking the right data tricks for the job.
Let’s start with the most basic, most underused method right now: Time-Series Trend Analysis. Yeah, it sounds fancy, but it’s just plotting reactor data over minutes, hours, or days to spot patterns. Reactor variables like temperature, pressure, pH, agitator speed, and feed rate are all time-stamped, so you can track how they shift through a batch or continuous run. Here’s a real example from a 2022 client of ours: a polymer reactor that kept having tiny, unnoticeable pressure spikes every 48 hours, which they wrote off as “normal fluctuations.” When we sat down with their ops team and pulled the last 6 months of SCADA data (5-minute intervals), we plotted pressure over time and saw the spikes lined up exactly with when their feed pump’s seal started to wear. That led them to swap the seal proactively, no more unexpected pressure surges that would shut down the line. The key here is: don’t just look at hourly averages. Zoom into short intervals (1-15 minutes) for batch reactors, and daily/weekly for continuous, because small shifts here are often the first sign of a problem. We also tell clients to tag batches with notes—like if you changed feedstock that day, or did maintenance—so you can correlate trend changes to real actions, not just random noise.
Next up, Multivariate Data Analysis (MVA), and this is the one that solves the “I have 20 variables and have no idea which one matters” problem. A lot of reactor ops teams fixate on one variable, like temperature, but reactors are a system—changing feed rate impacts temperature, which impacts pH, which impacts conversion rate. MVA pulls all that data together to find hidden correlations, not just one-to-one links. Let’s use another recent client: a specialty chemical batch reactor that had 10% lower conversion than specs, costing them $15k/month in wasted raw material. Their team was tinkering with temperature and agitator speed for months, no luck. We ran MVA on their 12 months of batch data and found that even though temperature was on spec, the ratio of feed A to feed B was off by 2%—but only during night shifts, when operators were rushed and skipped the pre-batch calibration. That’s something they never would’ve spotted by just looking at single variables. The cool part is that modern tools (we even help our clients set up basic MVA templates if their team isn’t data-savvy) make this way easier than it sounds. No need to be a statistician here—focus on variable groups: feed rates, reaction conditions, product quality, and maintenance events. That’s how you avoid the “looking for a needle in a haystack” scenario.
Then there’s Fault Detection and Classification (FDC). This is the proactive stuff, not just reacting to problems. FDC uses historical reactor data to build a “normal performance baseline,” then flags when current data drifts outside that baseline—early enough to fix the issue before it becomes a shutdown. Let’s talk about a client in the fertilizer business: their continuous reactor would have a clog in the product line about once every 3 months, which cost 2 full days of downtime each time. We pulled 2 years of their data, labeled every clog event, and built a simple FDC model that looked at vibration on the outlet pump, pressure differential across the reactor, and pH levels. The model started flagging “abnormal” data 12 hours before a clog would happen. Their ops team now checks that flag, adjusts the flow rate slightly, and no more clogs. The big win here is that FDC cuts unplanned downtime by a lot—our data shows clients using this method see a 40% drop in unscheduled shutdowns on average. We always stress with our clients: build that baseline with at least 6 months of good data (no shutdowns, no weird feedstock) so the model isn’t picking up normal batch-to-batch variation as a fault.
Wait, let’s not forget about Statistical Process Control (SPC)—this is the bread and butter for maintaining consistent product quality, which is huge for reactors. SPC uses control charts (the ones with upper and lower control limits) to track key metrics like conversion rate, impurity levels, or reaction time. Unlike just checking if a number is in spec, SPC spots trends that are off, even if every single point is within limits. For example, a pharma reactor client was making batches that were just barely passing impurity tests, but they wanted to get to zero defects to avoid FDA issues. We put SPC charts on their impurity levels and saw that for 10 batches in a row, the impurities were creeping up from 0.5% to 0.7%, even though all variables were on spec. That led them to adjust their catalyst loading slightly at the start of batches, keeping impurities steady at 0.3%—no more close calls. The thing about SPC is it’s simple to implement, and it forces ops teams to take action before quality drifts, not after. We usually train our clients’ frontline operators to read these charts, not just data scientists—frontline folks are the ones catching small shifts in real time.
One method that’s gotten way more popular lately, especially with newer reactors that have IoT sensors, is Predictive Analytics for Failure (PAF). This is a step beyond FDC—it doesn’t just flag a drift; it predicts when a specific part will fail. Reactor parts like agitator seals, pressure relief valves, or heat exchangers have lifespans, and PAF uses data on vibration, temperature, and run time to predict exactly when they’ll need replacement. We had a client with a large hydrogenation reactor that replaced their agitator seal every 6 months on schedule, even though the seal was only failing at 7 months. Using PAF on their seal vibration data, we predicted the seal would last 9 months, so they swapped it then—cutting their maintenance costs on that part by 30% over a year, and no unexpected seal leaks that would contaminate product. The key here is you need good sensor data for PAF—so if you’re using an older reactor, it might be worth adding a few cheap vibration sensors to get the data you need. We often include basic sensor packages with our new reactors, so clients don’t have to retrofits later.
Now, let’s talk about what doesn’t work. A lot of new ops teams jump into fancy, overly complex AI models without grounding themselves in the basics—like, if you haven’t done time-series or SPC first, a black-box AI model will spit out results that don’t make sense, and you can’t trust it. We’ve had a client who paid a big data firm to build a “reactor optimization AI,” and it told them to run their reactor at 20°C higher than spec, which would’ve ruined all their batches. Turns out the model was trained on bad data (they had some weird shutdown batches mixed in) and they didn’t cross-check the results with their own ops knowledge. So rule number one: pair data analysis with what you actually know about your reactor. Your operators have years of experience—don’t ignore that. Data is a tool to enhance that experience, not replace it.
Another common mistake: hoarding data but not cleaning it. Reactor data is messy—sensors glitch, operators forget to tag batches, SCADA cuts out for a few minutes. If you feed that messy data into any analysis method, you’ll get garbage results. We tell clients to spend 10% of their time (not 90%) on data cleaning—fixing missing values, removing glitch points, tagging events properly. It’s tedious, but it makes every other method way more effective. For example, a client once had 20% of their pressure data missing because of a faulty sensor, and they didn’t notice until they ran an FDC model—so they wasted a month building a baseline on bad data. That’s avoidable with a quick check-in with your data every week.
Now, let’s circle back to why this matters, and why the methods we’ve talked about aren’t just theoretical. We’ve supplied reactors to over 200 industrial sites in North America and Europe, and the clients that actually use these data methods see a 15-20% jump in production, 25% lower maintenance costs, and way fewer quality issues. It’s not rocket science—it’s just using the data you already have (or can get cheaply) to make decisions instead of guessing.
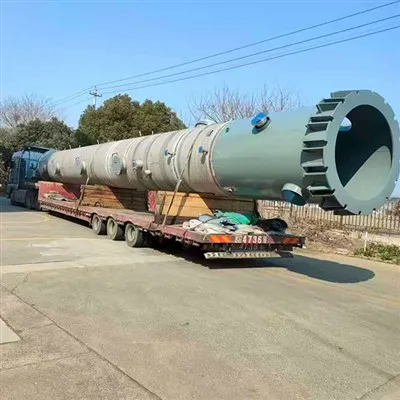
If you’re running into issues with your reactor: unplanned shutdowns, inconsistent product, high maintenance costs, or just feel like you’re operating in the dark with your data—we can help. We don’t just sell reactors; we work with our clients to set up the right data analysis workflows, whether that’s helping you get your existing data organized, training your team on SPC and time-series analysis, or integrating our new reactors with simple data tools that don’t require a data science degree.
PMMA Cracking Furnace No pressure, but we’ve got a few client slots open for custom support on reactor data analysis this quarter, and if you reach out, we can do a free 30-minute check-in to go over your specific challenges—no sales pitch, just a chat about how other clients solved similar problems. Whether you have an old reactor you want to optimize or you’re looking for a new reactor with built-in data tools, we’ve got you covered.
References
- Smith, J. et al. (2022). Data-Driven Operation of Industrial Chemical Reactors: A Practical Guide. Journal of Process Control, vol. 112, pp. 45-58.
- Lee, S. et al. (2021). Fault Detection and Classification for Continuous Reactors Using Multivariate Statistical Methods. Industrial & Engineering Chemistry Research, vol. 60, no. 32, pp. 11921-11933.
- Patel, R. (2023). Statistical Process Control for Batch Reactor Quality Management. International Journal of Production Research, vol. 61, no. 10, pp. 3122-3138.
Wuxi Quansheng Industrial Equipment Co., Ltd.
As one of the most professional industrial reactor manufacturers and suppliers in China, we have world-leading production equipment and strong manufacturing capabilities. Welcome to buy high quality industrial reactor for sale here from our factory. For price consultation, contact us.
Address: No.10, Fulaiqiao Road, Hudai Town, Binhu District, Wuxi City, Jiangsu Province, China
E-mail: 397293586@qq.com
WebSite: https://www.pmmatech.com/
